Imagine that entrepreneur X has a website that sells agricultural fertilizers. On the eve of another peak in sales, they decided to re-launch contextual advertising in order to “surpass” the revenue of last year’s same quarter. they launch an advertising campaign, create ads based on the same thematic queries (well, they worked last year). Waiting for a day, two, a week, and sales are not growing. Why?
Because there is such a thing as trends: this month, Internet users in your region are most interested in seedlings, and next month - in fertilizers. To create an effective advertising campaign in search engines, you need to analyze the statistics of Google queries and focus specifically on the needs of the target audience. If, for example, you have an online store and you want to expand your assortment with certain products in the “Cosmetics” category, you should first analyze whether they are in demand at all.
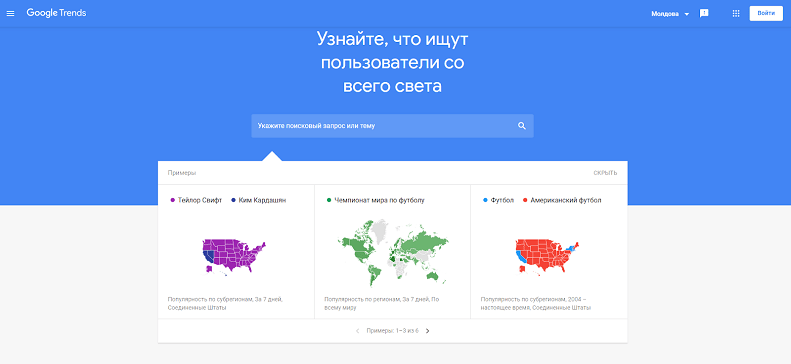
In these situations and in many others, Google Trends will help you out - a free and underestimated, in my opinion, service for analyzing the popularity of search queries and topics in the search engine of the same name. With its help, you can monitor the seasonality coefficient and write out similar queries. Google Trends allows you to see trends not only for web searches, but for images, news, products, and even Youtube.
The tracking of trends is a very useful feature, it can be used to track query trends across different categories and regions.
Seasonality analysis the service allows you to see the dynamics of popularity, by analyzing which you can understand which requests and at what time are most in demand.
The tracking of trends are a very handy feature for breaking down and finding related keywords.
Comparison of requests - the service allows you to compare several requests for a more comprehensive analysis.
We will take "website creation", as an example, and — "website promotion". for comparison. Go to the Google Trends page and type in the request. Optionally, you can immediately compare the keyword with another query by clicking on the "+ Compare" button:

But first things first. There are 4 configurable parameters under the query string to more accurately identify trends and track changes. So, we can set the:
Region — by specifying it, you can see what users are most actively googling in a particular country and even a city.
Period — Google Trends gives you quite a lot of choice, so you can request statistics for the last hour / 4 hours, for the last day, for the last 7 days, 30 days, 90 days, 5 years and since 2004. You can also choose an arbitrary time period.
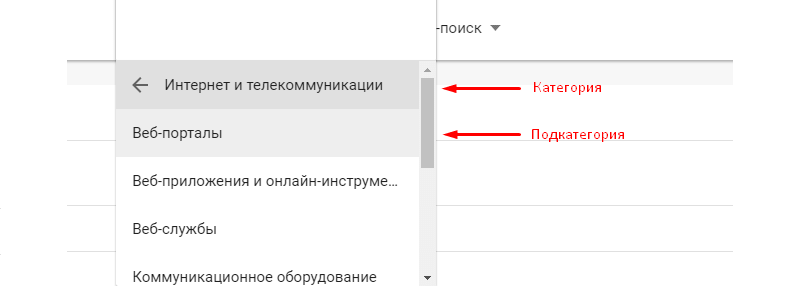
Category— this function is useful if your query has multiple values.
Search type — web search is the standard, but you can change it to search by images, news, products and Youtube.
So, we select the country, the period for which we need information, the category (optional) and the type of search. Here's what we got:
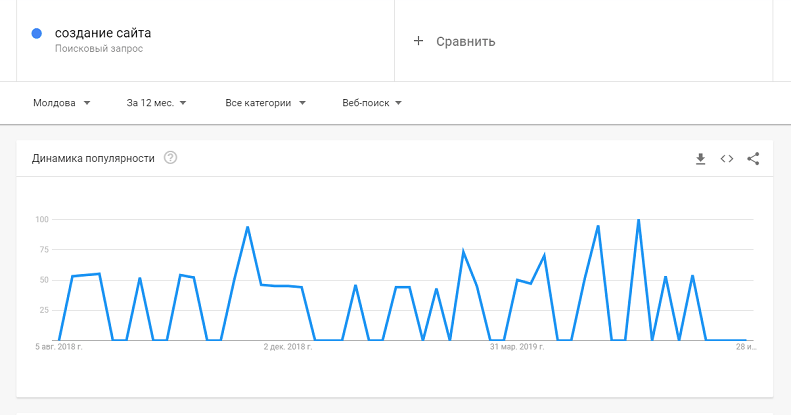
The graph shows at what time intervals Moldovans most actively requested “website creation”.
“Popularity dynamics — is a scale of the frequency of impressions for a specific query, which is displayed in accordance with the specified parameters. It represents the ratio of the number of requests to a certain period of time ”.
The more often Internet users search for a certain word / phrase, the more trendy it is.
“In addition to popularity dynamics, Google Trends shows popularity across sub-regions. Subregions are distinct regions, cities and towns within a single country. Thus, you get the most accurate information about the origin of the request ”.
How it looks (for clarity, we chose "roses")):
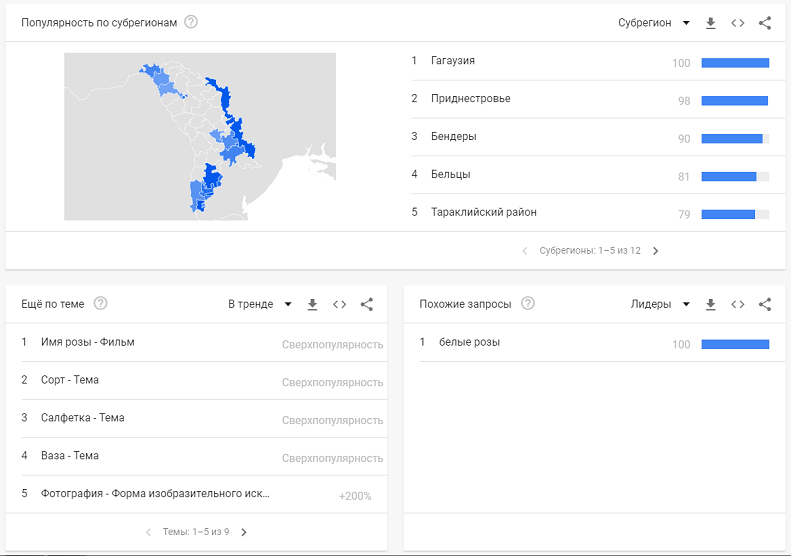
The darker the color on the map, the more requests there are in this sub-region.
Below the statistics of queries by subregion, we see the section “More on the topic”, which displays other trending queries, and next - “Similar queries”. You can change the setting of related queries from Trending to Leaders and see variations of the most popular queries that are similar to yours.
“For certain queries, it makes sense to look at the seasonality by changing the period from 12 months, for example, to 5 years.”
So, analyzing "roses to buy" in any region, you will notice that this request is most popular in March (annually, of course):

The keyword statistics by region / city and seasonality are very useful features in Google Trends. With their help, you can not only identify possible sales markets for goods / services, but also the periods of times when they will be in greatest demand. Agree, it makes no sense to start selling products in the summer, which are most often requested in winter.
If you have two or more similar (optional) keywords for comparison, it is enough to enter them into the search, and the service will immediately display the data:
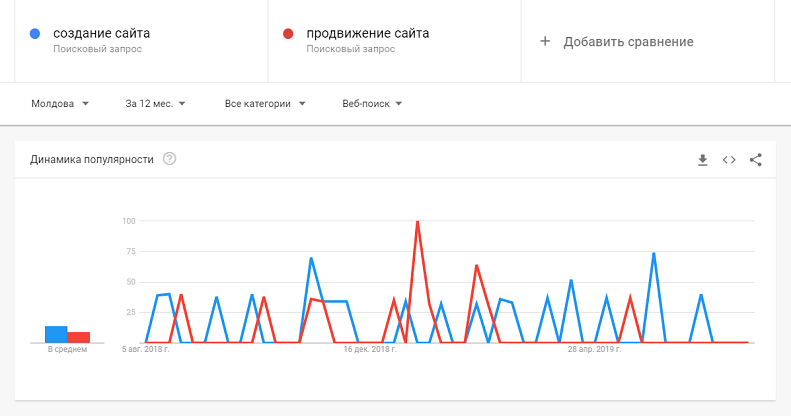
As you can see, the dynamics lined up under the queries: the first two columns show the average popularity indicator, and the graph is located next to it. We can clearly see that "website creation" is searched more often than "website promotion". More accurate data can be seen by hovering the mouse cursor over the areas of interest on the graph.
Google Trends, like the Google search engine itself, has operators for simplified searches:
Quotation marks (“create a site”) are used for an exact search. Quotation marks prevent you from changing the word order and showing similar queries. But keywords with additional words will still be displayed, for example, to create a website is inexpensive.
Plus (create a site + the creation of a site) - this operator adds additional words and synonyms to the statistics, which allows you to cover the maximum number of similar spellings of the phrase.
Minus (create a website -free) - using the minus sign “-”, you can exclude a certain word from statistics, for example, “free”.
Google Trends is a really useful tool for tracking target audience activity, finding new markets, developing a semantic core, properly planning advertising campaigns and replenishing the “cauldron” of ideas for writing content. It is unlikely to be suitable for analyzing the frequency of a large number of keywords, but it will definitely come in handy to analyze seasonality, current trends and forecast demand.
Our team confidently recommends this service to novice PPC managers and those who run their own business. However, you should not focus solely on Google Trends, it is better to use it in conjunction with other analytical tools for completeness of query analysis.
Studio Webmaster company offers its services for a full audit of the site, in particular, we provide analysis of the site for viruses. Protect yourself and your web resource.
Leaders in the IT market |
| 14+ years of experience and innovative solutions to help your business stand out and grow. |
Inspiring portfolio |
| 150+ successful projects: from sleek landing pages to complex corporate systems. |
Team of experts |
| 51+ professionals who bring your ideas to life with maximum efficiency. |

| NOTORIUM TRADEMARK AWARDS |
| Notorium Trophy 2017, Notorium Gold Medal 2018, Notorium Gold Medal 2019 |

| TRADE MARK OF THE YEAR |
| Gold Medal 2016, Gold Medal 2017, Gold Medal 2018, Gold Medal 2019 |

| THE BEST EMPLOYER OF THE YEAR |
| According to the annual Survey conducted by AXA Management Consulting - 2017, 2018, 2019 |